
Tools and Estimators to Support Hand Counting
Whether researching or implementing hand counting, it’s important to base estimates on facts, not guesses or myths. We provide tools and estimators to support the process.
Use Facts to Calculate Provable Estimates
Show Me
Estimates Instead of Guesses
Get as close as possible to apples-to-apples comparison of hand-counting vs machines — at least for hand-counting, machine details are elusive (or proprietary).
About Training
Online and in-person training is available along with materials. See the Training page.
Resource Materials
The eManual, guide books, workbooks, and blank hand count forms. See the Resources page.
Tab through the Estimators and Tools

How Many People? How Much Does It Cost? What if…?
We talk about questions like these as “myths,” because they usually are not posed as questions. Instead, they tend to be declarations by someone who is guessing or using absurd estimates based on lack of knowledge.
But they are legitimate QUESTIONS to be asked – and answered! We created an estimator tool that, based on historical voter turnout, will estimate costs, counters needed, and more to answer these questions.
The Hand Count Estimator
The Hand Count Estimator tool is a Microsoft Excel spreadsheet. The screenshot shows a portion of the final report.
After entering historical data and voter turnout projections, the spreadsheet auto-calculates estimates for costs, labor, and more. It is then possible to “tweak” projections to get real‑time updates on how costs, staffing, etc., would be affected by changing number of people on a counting team, length of shifts, hourly wage, etc.
For example, the clerk in the Wyoming “human error” article stated that hand counting costs for the county would range from $99,000 to $1.4 million, and about 2,200 people would be needed to count 20,000 ballots in four hours.
As can be seen in the results of the calculator above, the estimate for teams of 4 people, counting all ballots in 4 hours, is 484 people at a labor cost of $29,040, if they are paid $15 per hour.
Refer to page 262 of the eManual for a more detailed explanation of the Hand Count Estimator. And use the Library Annex below for more documentation about this estimator tool.

What if our county does not have voting at the precinct level?
What if ballots are counted in a central counting location? How about absentee and early votes — there can be thousands of those to count?
These questions are very similar to the Findings presented in, “Works in Any County, Any Size” beginning on page 271 of the eManual. We provide an estimating tool to provide the same details as the Hand Count Estimator, except for single- or large-locations used for counting ballots.
The Central Counting Locations Estimator
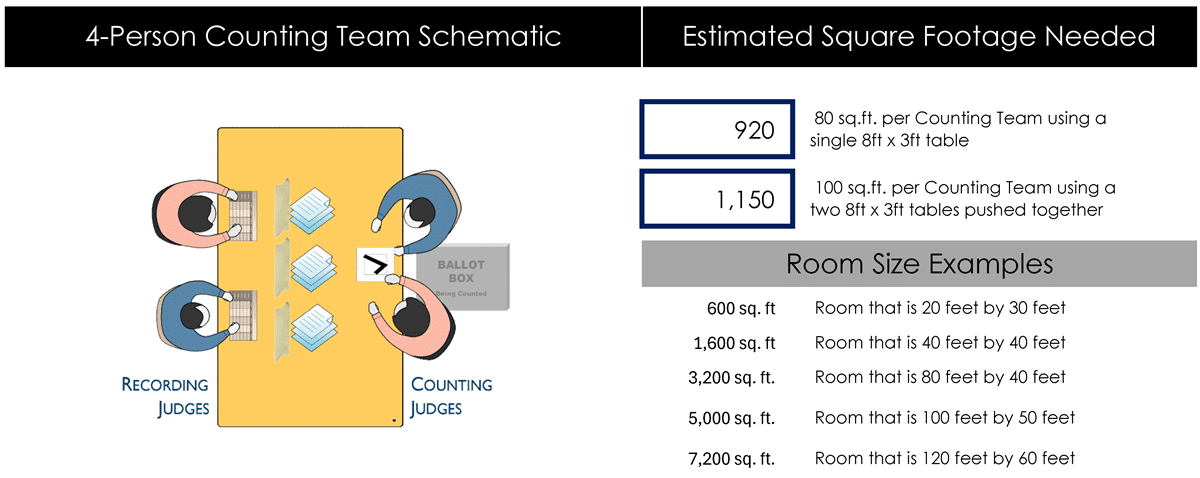
The screenshot above is a portion of the full spreadsheet. It shows a Wyoming county (about 20,000 registered voters) with absentee and early absentee ballots. The results are based on counting these ballots in 4 hours with teams of 4 counters.
Looking at the column on the right, the estimates show that 188 counters are needed, separated into 47 teams. How much space will that take, this estimator includes an estimation of square footage needed.
Refer to page 264 of the eManual for a more detailed explanation of the Hand Count Estimator. And use the Library Annex below for more documentation about this estimator tool.
Link to Central Counting Location Estimator

How Do We Plan for Supplies and Forms?
Whether working on a cost comparison, planning for an official election, or putting together emergency supplies, it is essential to have an approximation of the supplies and forms needed for hand counting in the county.
The Forms and Supplies Estimator
Estimating forms and supplies is based on the same data used in other estimators: historical voter turnout. This historical data will help to project the anticipated voter turnout per polling place. The other projections needed are anticipated number of “choices” on the ballot (total candidates plus lines for write-ins), and whether there will be “questions” (Yes/No options).
This estimator will then estimate which forms are needed and in what quantities for each polling place. It will also estimate the supplies per polling place down to the number of binder clips and Sharpies.
The total row will provide the “shopping list,” while the individual polling place (precinct) rows will save the election official time in sorting the forms and supplies and packing for each location.
The screenshot above is a small snip of the full spreadsheet.
Refer to page 265 of the eManual for a more detailed explanation of the Forms and Supplies Estimator. And use the Library Annex below for more documentation about this estimator tool.
Link to Forms and Supplies Estimator

Is it possible to Count Ballots Where They are Cast?
Yes, and creating visualization charts illustrating voter turnout is a great tool for presentations that include this topic.
Visualization Tool: Voter Turnout
While this tool is not an estimator, it uses the same data as the estimators: historical voter turnout. What this tool does is create visualizations.
Most election officials who object to hand counting probably do so because they feel they are already stretched thin for EVERY election. And they probably are because, consider this: they have to do all the same tasks for EVERY election no matter if the turnout is 10,000 voters or 100,000 voters. Why? Because using voting machines requires the same steps for EVERY election.
Machines are pulled out of storage, programmed, tested, delivered to polling places, recovered after the election, tested again, and returned to storage with 24/7 security. That’s just the basics. If a “glitch” is encountered anywhere along the way, reprogramming, issues with ballots, or myriad tasks could arise adding to the burden of voting machines and, possibly, requiring some ballots to be dropped in “Box 3” and counted at the clerk’s office.
Compare with hand counting: supplies are already being packed for polling places; some additional supplies will be required. There’s no programming, and no testing before or after the election. A “glitch” might be a shortage of supplies, but any ballot issues are taken care of at the polling place and everything is counted.
Remember, Presidential Elections Only Happen Every Four Years
The other reality is that election officials are putting in a lot of work for the elections between Presidential elections. The money and time spent for these ‘in-between’ elections is ridiculous and wasteful.
Look at the bar chart above. Cape Girardeau County in Missouri has about 55,000 registered voters. Each vertical bar is the voter turnout for a precinct/polling place. Three elections are displayed: a presidential held once every 4 years (dark blue), a municipal held yearly (red), and a mid-term primary held every 2 years (light blue).
The horizontal lines represent counting teams – in this example for every 600 ballots cast: purple is 600 ballots (recommend 1 counting team), gold is 1,200 ballots (recommend 2 counting teams), and green is 1,800 ballots (recommend 3 counting teams).
Cape voters should be aghast that they are paying for expensive voting equipment when only 1 precinct had more than 600 ballots cast for municipal elections (red), and 3 precincts were more than 600 ballots cast for in the primary (light blue).
What is remarkable, though, for the people of the Cape, is how few precincts need more than 1 or 2 counting teams for a presidential election (dark blue). With 34 precincts (voting locations), Cape needs 136 counters to put 1 counting team per location. But if Cape doubled that number, added another 136 just for the presidential election every 4 years, they would have enough people to HAND COUNT ballots and stop paying for voting machines. With 55,000 registered voters, are there 272 people in Cape Girardeau County willing to hand count their elections?
What About Visualizations for Larger Counties?
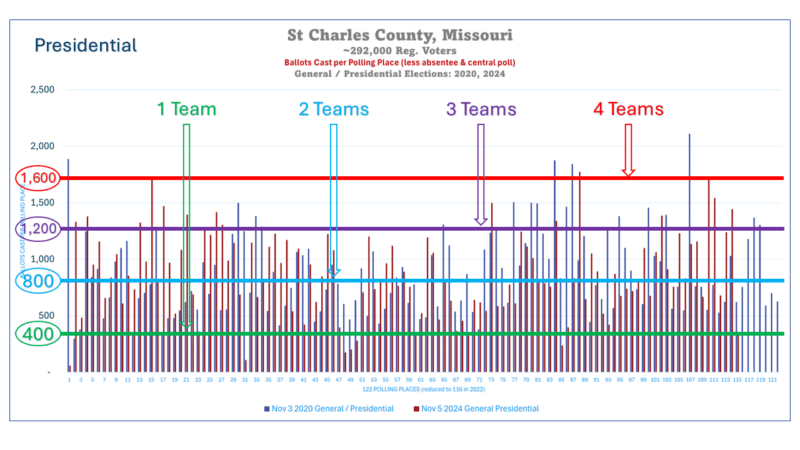
Look at the chart above for St. Charles County, Missouri, which has about 292,000 registered voters. The first visualization shows voter turnout from the 2020 (blue) and 2024 (red) presidential elections. So, this does not compare election types like we did with Cape Girardeau, it is showing turnout for presidential elections. You might also notice that there are less red vertical bars – this is because the county reallocated polling places and reduced the total by about 7 locations.
The horizontal lines show counting teams, but this chart is in increments of 400 ballots cast (which would equate to 8 hours).
For a presidential election that occurs once every 4 years, it appears most polling locations will benefit from having 2 counting teams. Perhaps about a third of locations would need 3 counting teams, but very few would need 4 or more counting teams. Again, this is based on counting all the ballots within 8 hours.
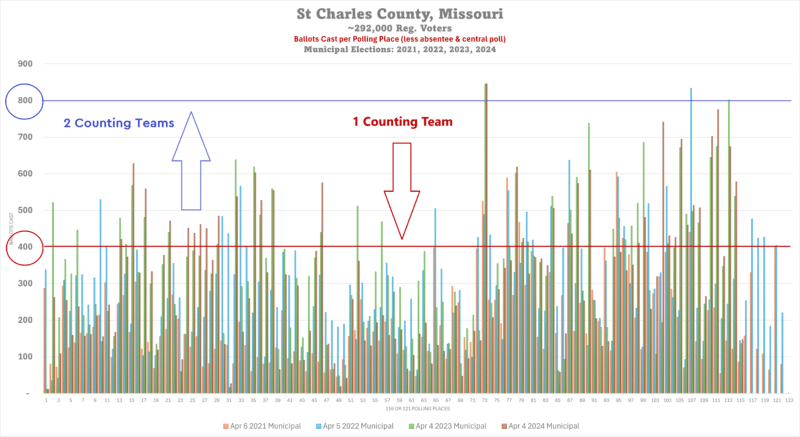
Now compare the chart above showing St. Charles voter turnout for municipal elections which occur every year. These elections are easily counted by 1 counting team per polling place for the majority with about a third benefiting from having 2 counting teams.
How many counters would St. Charles need for a municipal election? About 550, including counting the absentee ballots. That’s 0.2% of the registered voters in the county. And what about once every 4 years for a presidential election? Probably around 1,550 counters, or 0.5% of registered voters. That means that less than 1% of registered voters in St. Charles County could count all the ballots for an election in 8 hours.
Refer to page 271 of the eManual for a more detailed explanation of visualizing voter turnout. And use the Library Annex below for more documentation about this visualization tool.
Link to Visualization: Voter Turnout

How Can a Citizen Verify Election Results?
Missouri has statutes about the final steps of an election before it is certified at the county level. That is the work done by a Verification Board.
Elections Results Verification Tool (ERV)
Read more about Verification Boards beginning on page 278 of the eManual. It seems to have become a ‘lost art’ in Missouri, with election officials using election judges or a ‘bipartisan team’ to do the certification. Not to mention that the People do not have access to much of the election result data, having to rely on voting machine reports posted on county websites.
In response to that, this tool was developed for use by both verification boards and individuals to review and verify election results. Even though we cannot see ‘inside’ the machines, there is information that can be monitored for accuracy.
The screenshot above is one tab of the ERV tool. It is information from an official Verification Board for the 2024 presidential election. Note the red box drawn around three cells in the bottom-right. The instructions state that these three totals must match, but they do not. There is a discrepancy of 53 ballots.
Keep in mind this information was compiled after the election official and staff, all the elections judges, and the bipartisan team had completed their work and felt that everything was accurate. It is the job of the Verification Board to “check the math” and, because of this spreadsheet, the error was detected.
The resolution was that the election official realized the test deck of 53 ballots which had been run through a tabulator prior to election day had not been cleared out. So those numbers were being included in the election results. Once the correction was made, the results were reconciled and certified.
Link to ERV
The Missouri Method
Return to Hand Counting
Is it possible to hand count ballots for an election without using voting machines? YES! Will it take days, weeks, or months to count all the ballots? NO – the time needed to hand count ballots is measured in hours. What about costs, accuracy, and the people needed to count ballots, and all the other so-called objections? Most objections are actually myths: popular beliefs that are false or unsupported.
Color-printed, paperback or hardcover binding, with the full hand-count process, Myth-Debunking Workbook, commentary, and resources. Learn more on our eManual page.
A Hand Counting Instruction Manual for a Complete Hand Count Process, with Commentary and Resources.


Preparing the Country for Hand Counting. Tell others that Hand Counting is Easy!

